


Table of Contents
How Does the Supply Curve Shift?
Global Sources: Bridging Supply and Demand in International Markets
What Is a Supply Curve?
In the realm of economics, understanding the supply curve is fundamental to grasping how markets operate. A supply curve is a graphical representation that depicts the relationship between the price of a good or service and the quantity that suppliers are willing and able to offer for sale over a specified period. This curve is typically upward sloping, reflecting the principle that as prices increase, suppliers are motivated to produce and sell more of the good. This behavior is driven by the potential for higher profits, which incentivizes producers to allocate more resources toward production.
The Origin and Importance of Supply Curves
The concept of the supply curve is rooted in the law of supply, a basic economic principle that describes how producers respond to price changes. By illustrating this relationship graphically, supply curves provide valuable insights into market dynamics and help economists and policymakers predict how changes in market conditions can affect supply levels. Understanding supply curves is crucial for businesses as they strategize pricing, production, and inventory management.
Historical Context and Evolution
Supply curves have evolved over time, with early economic thinkers like Adam Smith laying the groundwork for modern supply and demand analysis. As economic theories developed, the supply curve became a central tool for analyzing market behaviors and predicting responses to economic policies.
Features of a Supply Curve
A supply curve is characterized by several key features that define its shape and position on a graph. These features are crucial for interpreting the curve and understanding the factors that influence supply.
Upward Slope
The most distinctive feature of a supply curve is its upward slope from left to right. This slope indicates that as the price of a good increases, the quantity supplied also rises. This positive relationship is due to the willingness of producers to supply more at higher prices, which cover costs and increase profit margins.
Shifts vs. Movements Along the Curve
It's important to distinguish between movements along the supply curve and shifts of the supply curve. A movement along the curve occurs when there is a change in the quantity supplied due to a price change, holding other factors constant. In contrast, a shift in the supply curve results from changes in non-price factors such as technology, input prices, or government regulations.
Factors Causing Shifts
Several factors can cause the supply curve to shift either to the right (increase in supply) or to the left (decrease in supply). These include advancements in technology, changes in production costs, taxes, subsidies, and expectations about future prices.
Elasticity of Supply
The elasticity of the supply curve measures how responsive the quantity supplied is to a change in price. If the supply is elastic, a small change in price leads to a large change in quantity supplied. Conversely, if the supply is inelastic, quantity supplied is less responsive to price changes.
Determinants of Supply Elasticity
The elasticity of supply is influenced by factors such as the availability of resources, production capacity, time period for adjustment, and the ease of entering or exiting the market.
How Does a Supply Curve Work?
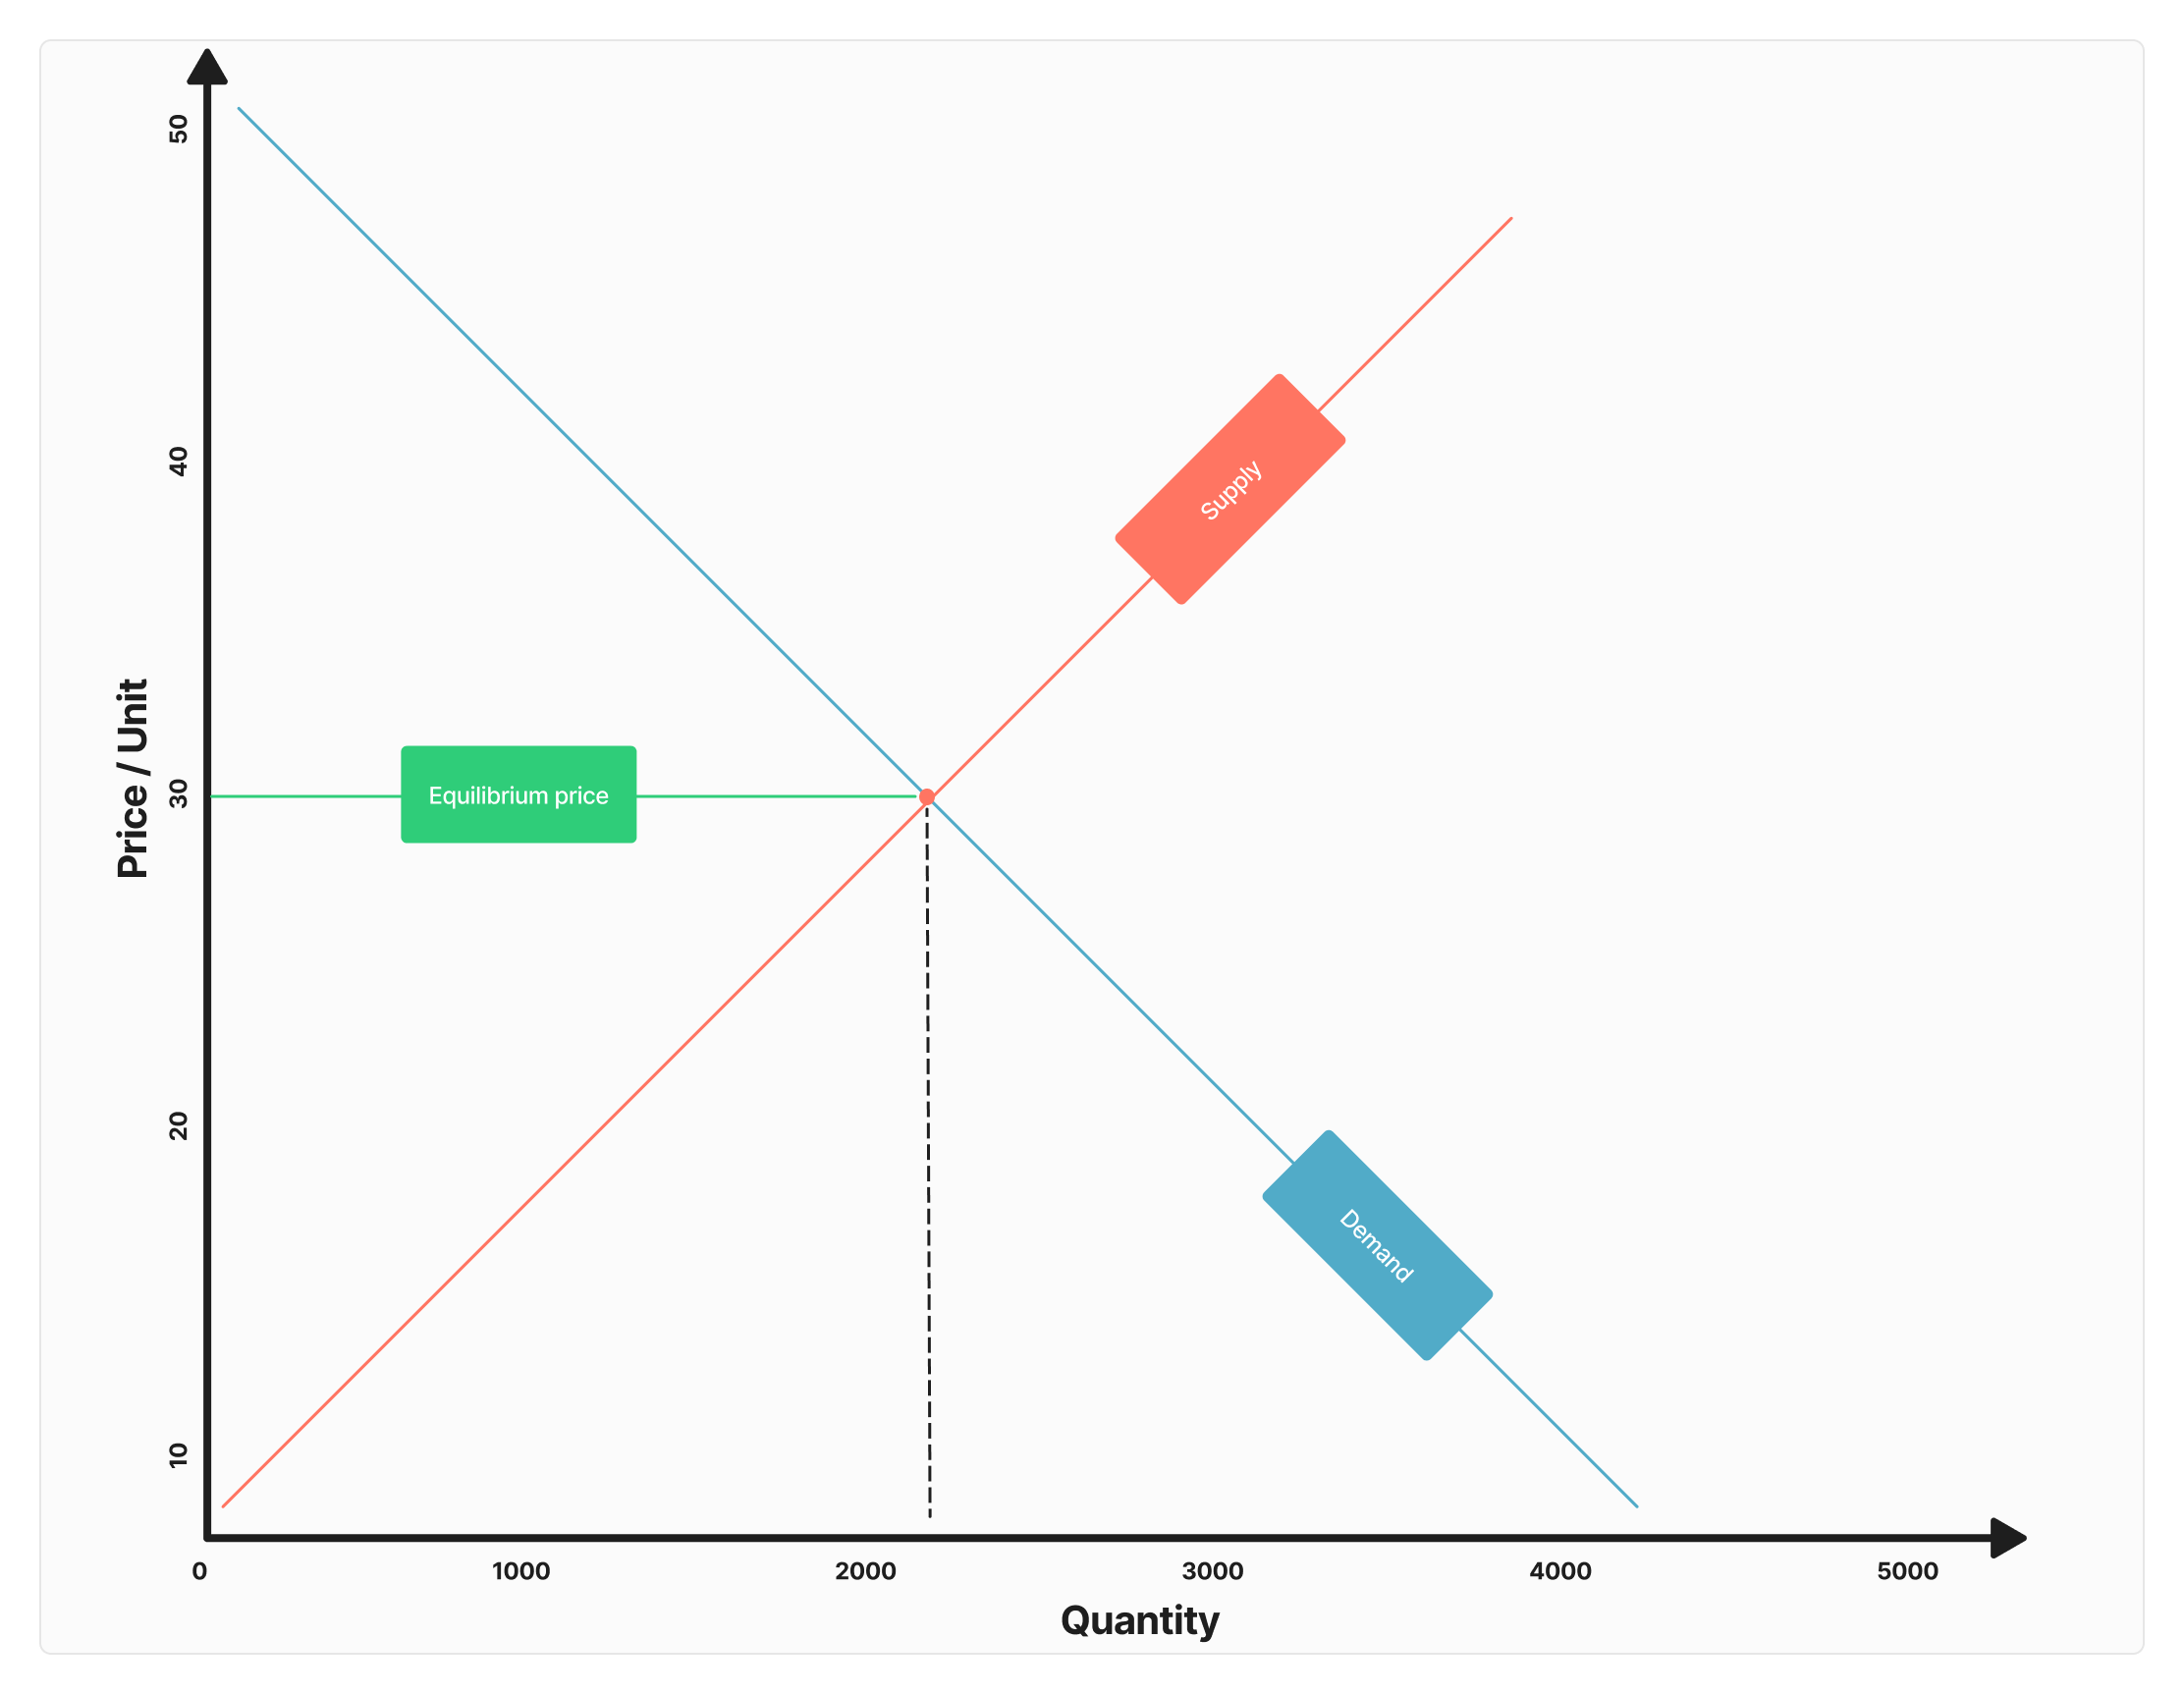
The supply curve operates within the broader context of market equilibrium, where it interacts with the demand curve to determine the market price and quantity of goods sold.
Interaction with Demand Curve
The intersection of the supply and demand curves represents the market equilibrium, where the quantity supplied equals the quantity demanded. At this point, the market clears, and there is no tendency for price to change unless there is a shift in either the supply or demand curve.
Equilibrium Price and Quantity
The equilibrium price is the price at which the quantity of a good supplied equals the quantity demanded. Changes in either the supply or demand curve can lead to a new equilibrium, impacting prices and quantities in the market.
Real-World Applications
Supply curves are used extensively in real-world applications to analyze market trends, forecast production needs, and make informed business decisions. For instance, companies use supply curve analysis to determine optimal pricing strategies and production levels in response to market changes.
Case Studies and Examples
Real-world examples, such as the oil market, illustrate how supply curves function in practice. In the oil industry, supply curves help predict how changes in global oil prices influence production levels and investment decisions.
Policy Implications
Understanding supply curves is also essential for policymakers who design economic policies to influence market outcomes. By analyzing supply curves, policymakers can anticipate the effects of taxes, subsidies, and regulations on production and market prices.
Impact of Government Interventions
Government interventions, such as price floors and ceilings, can disrupt the natural functioning of supply curves, leading to surpluses or shortages. Analyzing these impacts helps in formulating effective policies that align with economic goals.
Challenges and Limitations
While supply curves are powerful analytical tools, they have limitations. Assumptions such as perfect competition and constant technology may not hold true in all markets, affecting the accuracy of supply curve predictions.
Addressing Limitations
Economists continuously refine supply curve models to account for real-world complexities, such as market imperfections and dynamic changes in technology and consumer preferences.
How Does the Supply Curve Shift?
In economics, the supply curve is a fundamental concept that illustrates the relationship between the price of a good and the quantity supplied by producers. However, this relationship is not static; it can shift due to various factors. Understanding these shifts is crucial for analyzing market dynamics and predicting changes in production and pricing strategies.
Factors That Cause Shifts in the Supply Curve
A shift in the supply curve occurs when a change in a non-price factor affects the quantity of a good that producers are willing to supply at any given price. These shifts can be either to the right (an increase in supply) or to the left (a decrease in supply).
Technological Advancements
Technological improvements can enhance production efficiency, allowing producers to supply more goods at the same price. For example, the introduction of automation in manufacturing can significantly increase output, shifting the supply curve to the right.
Changes in Input Prices
The cost of inputs such as labor, raw materials, and energy can influence supply. A decrease in input prices reduces production costs, encouraging producers to supply more, thus shifting the supply curve to the right. Conversely, an increase in input prices can decrease supply, shifting the curve to the left.
Government Policies and Regulations
Government interventions, including taxes, subsidies, and regulations, can impact supply. A subsidy can lower production costs, increasing supply and shifting the curve to the right. In contrast, increased taxes or stringent regulations can raise costs and reduce supply, shifting the curve to the left.
Expectations of Future Prices
If producers expect higher future prices, they might reduce current supply to sell more in the future, shifting the current supply curve to the left. Conversely, expectations of lower future prices can increase current supply as producers seek to sell more before prices drop, shifting the curve to the right.
Number of Suppliers
An increase in the number of suppliers in the market generally increases the total quantity supplied, shifting the supply curve to the right. Conversely, a decrease in the number of suppliers shifts the curve to the left.
Short-Term vs. Long-Term Shifts
The timeframe over which these factors operate can also affect supply curve shifts. In the short term, some factors like input price changes can have immediate effects, while long-term shifts might result from technological advancements or changes in industry structure.
Supply Curve vs. Demand Curve
The supply curve is often analyzed in conjunction with the demand curve to understand market equilibrium and price determination. While both curves are essential for market analysis, they represent different economic behaviors.
Understanding the Demand Curve
The demand curve shows the relationship between the price of a good and the quantity demanded by consumers. Typically, it slopes downward from left to right, indicating that as the price decreases, the quantity demanded increases.
Key Differences Between Supply and Demand Curves
- Slope Direction: The supply curve generally slopes upward, while the demand curve slopes downward.
- Determinants: Supply is influenced by factors like production costs and technology, whereas demand is affected by consumer preferences, income, and prices of related goods.
- Market Forces: Supply reflects producers' willingness to sell, while demand reflects consumers' willingness to buy.
Interaction and Market Equilibrium
The intersection of the supply and demand curves determines the market equilibrium, where the quantity supplied equals the quantity demanded. This equilibrium price is where the market clears, with no surplus or shortage.
Shifts and Their Effects on Equilibrium
When either the supply or demand curve shifts, it results in a new equilibrium price and quantity. For instance, an increase in supply, with demand constant, leads to a lower equilibrium price and a higher equilibrium quantity.
Real-World Implications
Understanding how supply and demand curves interact is crucial for businesses and policymakers. It helps in setting prices, planning production, and implementing economic policies that stabilize markets.
Example of a Supply Curve
To illustrate how supply curves function in real-world scenarios, let's consider a specific example from the agricultural sector: the supply curve for wheat.
The Wheat Supply Curve
Wheat is a staple crop with significant economic importance. The supply curve for wheat reflects the relationship between the price of wheat and the quantity that farmers are willing to supply.
Factors Influencing Wheat Supply
- Weather Conditions: Favorable weather can increase wheat yields, shifting the supply curve to the right. Conversely, adverse weather conditions like droughts can decrease supply, shifting the curve to the left.
- Technological Innovations: Advances in agricultural technology, such as genetically modified seeds or improved irrigation systems, can boost wheat production, shifting the supply curve to the right.
- Market Prices: If wheat prices are expected to rise, farmers might hold back some of their harvest to sell later at higher prices, temporarily shifting the supply curve to the left.
Analyzing Shifts in the Wheat Supply Curve
Consider a scenario where a new drought-resistant wheat variety is introduced. This innovation allows farmers to maintain high yields even in dry conditions, effectively increasing the overall supply of wheat. The supply curve shifts to the right, leading to a lower equilibrium price if demand remains constant.
Impact on Global Markets
Changes in the supply of a major crop like wheat can have significant implications for global food markets. A shift in the supply curve can affect prices not only domestically but also internationally, influencing food security and trade dynamics.
Lessons from the Wheat Market
The wheat market example highlights the importance of understanding supply curve shifts in agriculture and other industries. It underscores how external factors and innovations can dramatically alter supply dynamics, affecting prices and market stability.
Global Sources: Bridging Supply and Demand in International Markets
In the dynamic realm of international trade, the role of intermediaries is crucial in connecting disparate market players. Global Sources stands out as a leading business-to-business (B2B) platform that effectively bridges the gap between suppliers and buyers, significantly influencing the global supply curve. By enhancing visibility and accessibility in the marketplace, Global Sources plays a pivotal role in shaping how goods are produced, priced, and distributed across international borders.
Expanding Market Access Through a Robust Online Marketplace
Global Sources operates a comprehensive online marketplace that serves as a crucial conduit for suppliers seeking to expand their reach. By providing a digital platform where suppliers can showcase their products to a global audience, Global Sources empowers businesses to transcend local market limitations. This increased visibility enables suppliers to tap into new customer bases, effectively expanding their market access. As a result, suppliers are encouraged to increase production levels, leading to a rightward shift in the supply curve. This shift represents a greater quantity of goods supplied at various price points, highlighting the impact of enhanced market access on global supply dynamics.
Facilitating Informed Decision-Making with Comprehensive Insights
One of the key contributions of Global Sources is its role in facilitating the flow of information between market participants. The platform offers detailed product descriptions, supplier profiles, and buyer reviews, equipping buyers with the insights needed to make informed purchasing decisions. This transparency is crucial in reducing uncertainty and fostering trust between suppliers and buyers. By promoting informed decision-making, Global Sources helps optimize the supply chain, resulting in a more responsive supply curve that can quickly adapt to changing market conditions. This adaptability is essential for maintaining equilibrium in supply and demand, especially in volatile markets.
Enabling Direct Connections Through Trade Shows and Exhibitions
Beyond its online presence, Global Sources organizes numerous trade shows and exhibitions, which are vital in fostering direct interactions between suppliers and buyers. These events provide a platform for face-to-face negotiations, allowing businesses to establish long-term partnerships and explore new market opportunities. By facilitating these direct connections, Global Sources enables suppliers to gain a deeper understanding of buyer preferences and market trends. This insight allows suppliers to tailor their production strategies to better meet market demands, contributing to a more balanced and efficient supply curve.
Providing Market Intelligence for Proactive Supply Management
Global Sources also plays a crucial role in providing market intelligence and trend analysis, empowering suppliers to anticipate changes in demand and adjust their supply strategies proactively. By staying informed about industry developments, suppliers can align their production with market needs, minimizing the risks of overproduction or shortages. This proactive approach to supply management helps stabilize prices and ensures a more balanced supply-demand equilibrium, contributing to a more efficient global market. The ability to anticipate and respond to market shifts is a key factor in maintaining a dynamic and responsive supply curve.
Enhancing Market Resilience During Periods of Volatility
The importance of Global Sources in bridging supply and demand becomes even more pronounced during periods of market volatility. Economic fluctuations, geopolitical tensions, and unexpected disruptions, such as pandemics, can severely impact traditional supply chains, leading to abrupt shifts in the supply curve. In such scenarios, Global Sources' platform offers a reliable resource for businesses seeking alternative suppliers or new markets. By providing a diverse pool of suppliers and buyers, the platform enhances market resilience and ensures the continued flow of goods across borders.
In conclusion, Global Sources plays an indispensable role in connecting suppliers and buyers in the international market, significantly influencing the global supply curve. Through its robust online marketplace, comprehensive insights, and strategic trade events, Global Sources facilitates efficient and responsive supply chains. As global trade continues to evolve, the company's efforts in bridging supply and demand will remain crucial in ensuring a dynamic and balanced global market. By supporting individual businesses and contributing to the broader stability and growth of international trade, Global Sources underscores its position as a key player in the global economy.
Supply Curve FAQs
Why Does a Supply Curve Slope Upward to the Right?
The upward slope of a supply curve is a fundamental concept in economics, reflecting the relationship between price and quantity supplied. This positive slope indicates that as the price of a good or service increases, the quantity supplied by producers also increases. Several key factors explain this phenomenon:
- Profit Incentive: The primary reason for the upward slope is the profit motive. Higher prices typically lead to higher potential profits for producers. As prices rise, businesses are more willing to increase production to capitalize on these potential profits. This willingness to supply more at higher prices results in the upward slope of the supply curve.
- Marginal Cost of Production: As production expands, the marginal cost of producing additional units may increase. This is due to factors such as the need to use less efficient resources, overtime pay for workers, or the need to operate additional shifts. To cover these higher marginal costs, producers require higher prices, which explains why they are willing to supply more only at higher prices.
- Resource Allocation: Higher prices can attract more resources into the production of a particular good. For instance, if the price of corn rises significantly, farmers may allocate more land and labor to corn production instead of other crops. This reallocation of resources results in an increased quantity supplied as prices rise.
- Market Entry: Rising prices can also encourage new firms to enter the market, increasing overall supply. When prices are high, barriers to entry may seem less daunting, and new producers might find it profitable to start production, contributing to a greater quantity supplied at higher prices.
- Economies of Scale: In some cases, higher production levels can lead to economies of scale, where the average cost per unit decreases as output increases. While this might initially seem contrary to the upward slope, it actually supports it by allowing firms to increase supply in response to higher prices without proportionally increasing costs.
- Expectations of Future Prices: If producers expect prices to continue rising, they might increase current production to take advantage of future higher prices. This expectation can reinforce the upward slope as producers adjust their output based on anticipated market conditions.
The upward slope of the supply curve is a reflection of these economic principles and behaviors. It illustrates how producers respond to price signals in the market, adjusting their output levels to maximize profits and efficiently allocate resources. This relationship is a cornerstone of supply-side economics and is critical for understanding how markets function and how prices are determined.
Overall, the upward slope of the supply curve encapsulates the dynamic interactions between price, production costs, and producer behavior, highlighting how these elements converge to shape supply decisions in the marketplace.
What Shifts the Supply Curve to the Left?
A leftward shift of the supply curve indicates a decrease in the quantity supplied at every price level. This shift can be caused by several factors that affect production costs, availability of resources, or regulatory conditions. Understanding these factors is crucial for analyzing market dynamics and predicting changes in supply.
- Increase in Production Costs: One of the most common reasons for a leftward shift in the supply curve is an increase in production costs. This can include higher prices for raw materials, labor, or energy. When production becomes more expensive, producers may reduce the quantity they are willing to supply at existing prices, resulting in a leftward shift of the supply curve.
- Technological Setbacks: While technological advancements can shift the supply curve to the right, setbacks or failures in technology can have the opposite effect. If a key technology becomes obsolete or fails to function efficiently, it can increase production costs or reduce output, shifting the supply curve to the left.
- Decrease in Number of Suppliers: A reduction in the number of firms or producers in the market can lead to a leftward shift of the supply curve. This might occur due to business closures, mergers, or exit from the market due to unprofitability or regulatory challenges.
- Government Regulations and Taxes: Increased regulation or higher taxes on production can decrease supply. For example, stricter environmental regulations might require costly compliance measures, reducing the quantity supplied. Similarly, higher taxes on production can increase costs and decrease supply, shifting the curve to the left.
- Natural Disasters and Supply Chain Disruptions: Events such as natural disasters, geopolitical conflicts, or significant disruptions in supply chains can reduce the availability of inputs or increase costs, leading to a decrease in supply. For example, a hurricane that damages crops or a conflict that interrupts oil supplies can shift the supply curve to the left.
- Expectations of Future Price Declines: If producers expect prices to fall in the future, they might reduce current production to avoid selling at lower prices later. This expectation can lead to a decrease in current supply, shifting the curve to the left.
- Resource Depletion: Over time, the depletion of natural resources can lead to a reduction in supply. For instance, if a key mineral becomes scarce, the supply of products dependent on that mineral may decrease, shifting the supply curve to the left.
These factors highlight the various external and internal influences that can lead to a decrease in supply. A leftward shift in the supply curve signifies that producers are less willing or able to supply goods at existing prices, which can result in higher equilibrium prices and lower equilibrium quantities in the market.
Understanding these shifts is essential for businesses and policymakers as they navigate changes in market conditions and develop strategies to mitigate the impacts of reduced supply
What Is the Supply Curve Sloping Curve?
The supply curve is a graphical representation that illustrates how the quantity of a good or service that producers are willing to supply varies with its price. It typically slopes upward from left to right, reflecting the direct relationship between price and quantity supplied. This slope is central to understanding how markets function and how producers respond to price changes.
- Basic Definition and Representation: On a standard graph, the supply curve is plotted with price on the vertical axis and quantity supplied on the horizontal axis. The upward slope indicates that as the price of a good increases, producers are willing to supply more of it. This is because higher prices generally lead to higher potential profits, incentivizing producers to increase output.
- Law of Supply: The upward slope of the supply curve is rooted in the law of supply, which states that, ceteris paribus (all else being equal), an increase in price results in an increase in quantity supplied. This principle is based on the assumption that higher prices make production more profitable, encouraging producers to expand their output.
- Marginal Cost Considerations: As production increases, the marginal cost of producing additional units can rise. This is due to factors such as the need to utilize less efficient resources or pay overtime wages. To cover these higher marginal costs, producers require higher prices, which contributes to the upward slope of the supply curve.
- Producer Behavior and Market Dynamics: The supply curve reflects the behavior of producers in response to market signals. It shows how producers adjust their output levels based on price changes. For example, if the price of a commodity rises, producers might increase supply by employing more resources, investing in new technology, or expanding operations.
- Economic Implications: The sloping nature of the supply curve has significant implications for market equilibrium and price determination. It interacts with the demand curve, which typically slopes downward, to establish the equilibrium price and quantity in a market. Changes in either curve can lead to shifts in equilibrium, affecting market outcomes.
- Elasticity of Supply: The steepness of the supply curve can vary depending on the elasticity of supply, which measures the responsiveness of quantity supplied to a change in price. A steeper curve indicates inelastic supply, where quantity supplied is less responsive to price changes. Conversely, a flatter curve represents elastic supply, where quantity supplied is more responsive.
- Applications and Limitations: While the supply curve is a powerful analytical tool, it operates under certain assumptions, such as perfect competition and constant technology. In reality, markets may experience imperfections or external shocks that affect supply dynamics. Economists use the supply curve as a foundational model, but they also consider these complexities when analyzing real-world scenarios.
In summary, the supply curve's upward slope is a fundamental concept that captures the relationship between price and quantity supplied. It reflects the economic principles of profit maximization, marginal cost, and producer behavior, playing a crucial role in market analysis and decision-making.
Why Does the Supply Curve Shift to the Right?
A rightward shift in the supply curve indicates an increase in the quantity supplied at every price level. This shift can result from various factors that enhance production capacity, reduce costs, or improve market conditions. Understanding these causes is essential for analyzing market trends and predicting changes in supply.
- Technological Advancements: One of the most significant factors that can shift the supply curve to the right is technological progress. Innovations and improvements in technology can enhance production efficiency, allowing producers to supply more goods at the same price. For instance, automation and advanced machinery can increase output, reducing production costs and shifting the supply curve to the right.
- Decrease in Input Prices: A reduction in the cost of inputs such as raw materials, labor, or energy can increase supply. When production becomes cheaper, producers are willing to supply more at existing prices, resulting in a rightward shift of the supply curve. For example, a decrease in oil prices can lower transportation and production costs across various industries, increasing supply.
- Government Policies and Subsidies: Favorable government policies, such as subsidies or tax incentives, can lower production costs and encourage producers to increase output. Subsidies directly reduce costs, enabling producers to supply more, while tax incentives can free up capital for investment in production expansion.
- Increase in Number of Suppliers: An increase in the number of firms or producers in the market can lead to a rightward shift of the supply curve. This might occur due to reduced barriers to entry, market liberalization, or increased competition. More suppliers mean greater overall market supply, shifting the curve to the right.
- Improved Resource Availability: An increase in the availability of key resources can enhance production capacity. For example, the discovery of new mineral deposits or improved access to water for agriculture can boost supply, shifting the curve to the right.
- Expectations of Higher Future Prices: If producers expect prices to rise in the future, they might increase current production to take advantage of expected higher prices. This behavior can lead to an increase in current supply, shifting the supply curve to the right as producers prepare for anticipated market conditions.
- Economies of Scale: As firms grow and expand their operations, they may achieve economies of scale, which reduce the average cost per unit of production. This reduction in costs can enable firms to supply more at all price levels, shifting the supply curve to the right.
These factors highlight the various conditions and changes that can lead to an increase in supply. A rightward shift in the supply curve signifies that producers are more willing or able to supply goods at existing prices, which can result in lower equilibrium prices and higher equilibrium quantities in the market.
Understanding these shifts is crucial for businesses and policymakers as they navigate changes in market conditions and develop strategies to capitalize on increased supply. By analyzing these factors, stakeholders can better anticipate market trends and make informed decisions to optimize production and pricing strategies.